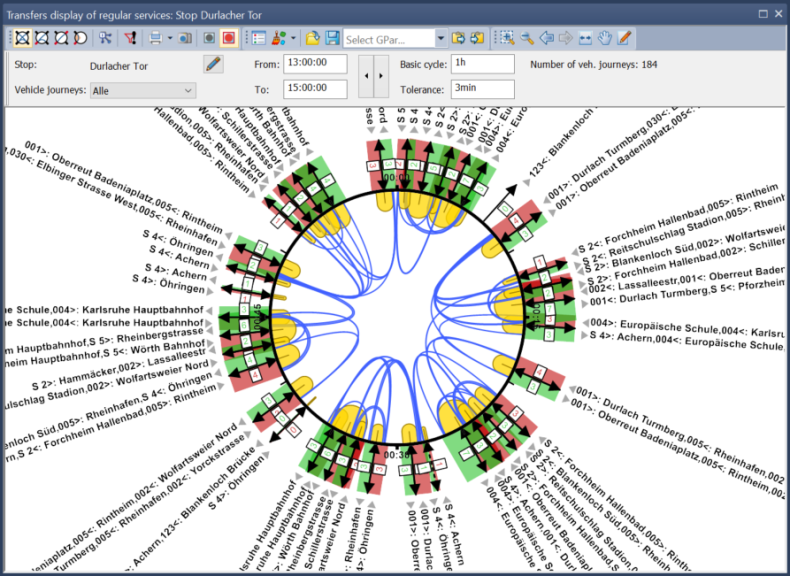
The transfers view displays connections on the supply side and volumes and transfer flows on the demand side (Using Visum: Displaying connections and transfer flows at stops).
The temporal distribution over the clock-face is defined by a basic cycle. Around the outer edge of the clock arriving and departing vehicle journeys are shown at the minute they pass the stop. Within time tolerances, vehicle journeys of the same line and direction can be aggregated to service groups, separately for arrival and departure. Accordingly, incoming and outgoing volumes as well as transfer flows within the stop can be displayed on this aggregation level. For matching connections, the transfer times inclusive of the walk times defined at the stop need to be taken into account. Transfer times and minimum walk times can be displayed in the shape of circular arcs for pairs of marked service groups.

Illustration 263: Transfers display of regular services
The assessment of connections is an important task for a planner. The view allows a detailed evaluation of connections and consistent connections, in particular in combination with differentiated demand flows. You can easily test and analyze the impact of several service variants on the demand flows at important transfer points.
The view of the clock-face primarily allows an analysis of transfer flows according to temporal aspects. Respective evaluations can be supplemented by the graphic display of the spatial transfer relations between stop areas in the network.

